About query analytics (QAN)
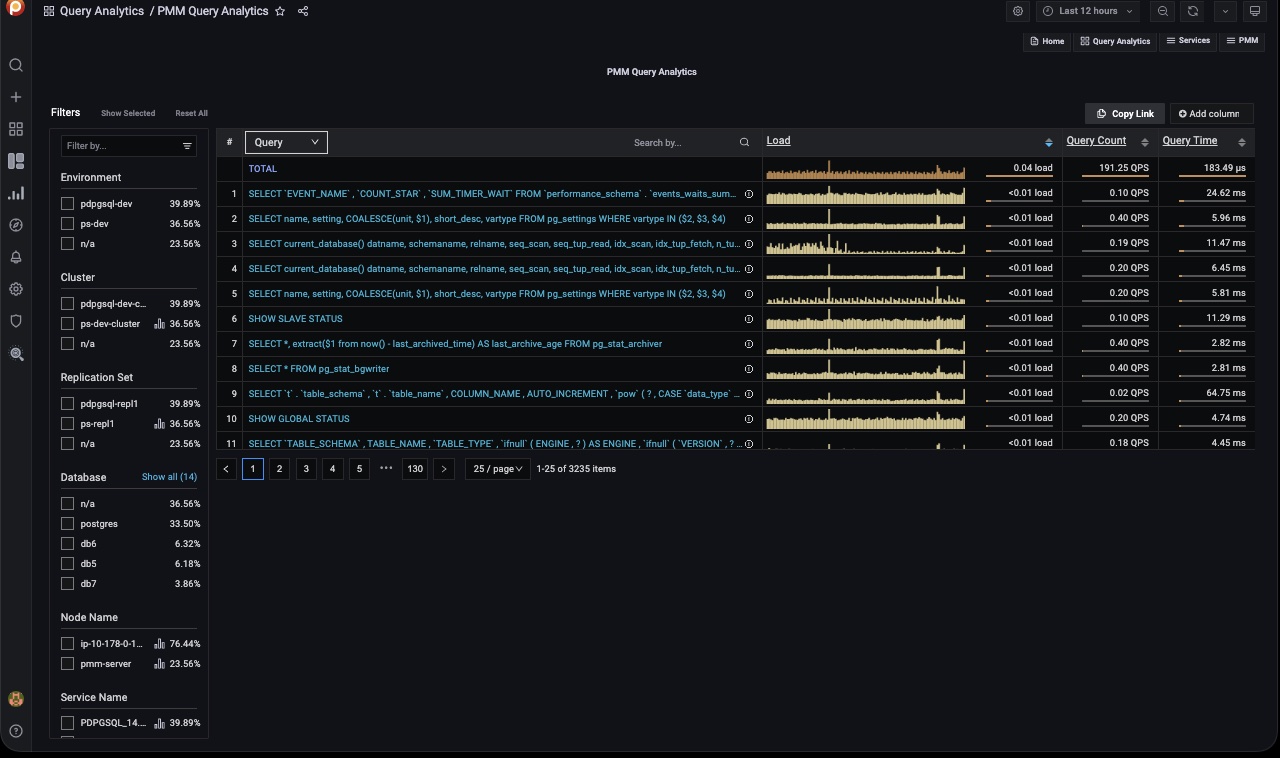
The Query Analytics dashboard shows how queries are executed and where they spend their time. It helps you analyze database queries over time, optimize database performance, and find and remedy the source of problems.
Supported databases
Query Analytics supports MySQL, MongoDB and PostgreSQL with the following minimum requirements:
- MySQL 5.1 or later (if using the slow query log)
- MySQL 5.6.9 or later (if using Performance Schema)
- Percona Server 5.6+ (all Performance Schema and slow log features)
- MariaDB 5.2+ (for user statistics), 10.0+ (for Performance Schema)
- PostgreSQL 11 or later
pg_stat_monitorextension (recommended) orpg_stat_statementsextension- Appropriate
shared_preload_librariesconfiguration - Superuser privileges for PMM monitoring account
- MongoDB 6.0 or later (4.4+ may work with limited features)
Requirements for Profiler
- Profiling enabled for Query Analytics
- Appropriate user roles:
clusterMonitor,read(local), and custom monitoring roles. For MongoDB 8.0+: AdditionaldirectShardOperationsrole required for sharded clusters
Requirements for Mongolog
- MongoDB configured to log slow operations to a file
- MongoDB server has write permissions to the log directory and file
- PMM agent has read permissions to the MongoDB log file
- Appropriate user roles:
clusterMonitor, or custom monitoring roles (getCmdLineOptsprivilege on{ cluster: true })
Dashboard components
Query Analytics displays metrics in both visual and numeric form. Performance-related characteristics appear as plotted graphics with summaries.
The dashboard contains three panels:
- the Filters panel
- the Overview panel
- the Details panel
Data retrieval delays
Query Analytics data retrieval is not instantaneous because metrics are collected once per minute. When collection delays occur, no data is reported and gaps will appear in the sparkline.
Limitation: Missing query examples in MySQL Performance Schema
When using MySQL’s Performance Schema as the query source, you may encounter the message “Sorry, no examples found” in the QAN dashboard. This typically occurs due to the way MySQL handles query sampling and can be influenced by the volume of unique queries, and Performance Schema settings.
Despite the absence of query examples, all other query metrics are still collected and displayed as expected.
Why this happens
MySQL Performance Schema manages query data across two different tables, which can lead to missing query examples:
-
Summary table (
events_statements_summary_by_digest): stores aggregated metrics for each normalized query (digest) in a limited buffer. Each unique query appears only once, regardless of how many times it runs. -
History table (
events_statements_historyorevents_statements_history_longin MariaDB): stores individual query executions in a limited rolling buffer. Multiple entries may exist for the same query, but older ones are overwritten as new queries are executed.
A query may appear in the digest summary but not in the history table when:
- it was executed frequently enough to appear in the digest summary
- all its individual executions were overwritten in the history buffer due to high query volume overwhelming the buffer and ongoing activity
When this happens, QAN can still display the query’s metrics, but cannot show an example query because it’s no longer available in events_statements_history table when PMM tries to capture it.
Performance Schema refresh rate tuning
PMM Agent includes a configurable Performance Schema Refresh Rate that can help capture more query examples. This setting controls how often PMM scrapes data from the history table. Using a shorter interval increases the likelihood that query examples will be captured before being overwritten.
Configuration options
- Default value: 5 seconds
- Minimum value: 1 second
- Value of 0 uses the default (5 seconds)
How to configure
- environment variable:
PMM_AGENT_PERFSCHEMA_REFRESH_RATE. - flag for PMM agent binary:
--perfschema-refresh-rate=NUMBER. - property in PMM agent config:
perfschema-refresh-rate: NUMBER.
Workaround
If you’re still missing some query examples, consider using the slow query log (slowlog) as the query source instead.
The slowlog retains actual query texts over time and can help capture examples even when Performance Schema history buffers are exhausted.