Connect MongoDB databases to PMM
Connect a MongoDB instance to PMM to monitor a MongoDB or Percona Server for MongoDB database server.
Prerequisites
Before you start, ensure you have:
- PMM Server installed and running with a known IP address or hostname accessible from the Client node.
- PMM Client installed and the nodes are registered with PMM Server.
- Admin privileges to install and configure PMM Client on the host.
- Preconfigured MongoDB user with appropriate monitoring privileges, or sufficient privileges to create the required roles and users.
- MongoDB server version 6.0 or higher. PMM may work with MongoDB versions as old as 4.4, but we recommend using MongoDB 6.0+ for complete feature support.
Create PMM account and set permissions
We recommend using a dedicated account to connect PMM Client to the monitored database instance. The permissions required depend on which PMM features you plan to use.
Run the example commands below in a mongo shell session to:
- Create custom roles with the privileges required for creating/restoring backups and working with Query Analytics (QAN).
- Create/update a database user with these roles, plus the built-in
clusterMonitorrole.
Important
Values for username (user) and password (pwd) are examples. Replace them before using these code snippets.
This role grants the essential minimum privileges needed for monitoring and QAN:
db.getSiblingDB("admin").createRole({
"role": "pmmMonitor",
"privileges": [
    {
    "resource": { "db": "", "collection": "" },
    "actions": [ "dbHash", "find", "listIndexes", "listCollections", "collStats", "dbStats", "indexStats" ]
    },
    {
    "resource": { "db": "", "collection": "system.version" },
    "actions": [ "find" ]
    },
    {
    "resource": { "db": "", "collection": "system.profile" },
    "actions": [ "dbStats", "collStats", "indexStats" ]
    }
],
"roles": [ ]
})
This role provides the necessary privileges for using PMM’s backup management features. It is required only if you plan to use this feature:
db.getSiblingDB("admin").createRole({
    "role": "pbmAnyAction",
    "privileges": [
    {
        "resource": { "anyResource": true  },
        "actions": [ "anyAction" ]
    }
    ],
    "roles": []
});
Create/update user and assign created roles
Create or update a user with the minimum required privileges for monitoring by assigning the following roles:
MongoDB 8.0 introduced stricter security for direct shard access. For MongoDB 8.0 and later, the PMM user also requires the directShardOperations role to collect complete metrics from all cluster components.
db.getSiblingDB("admin").createUser({
    "user": "pmm",
    "pwd": "<SECURE_PASSWORD>",  // Replace with a secure password
    "roles": [
        { "db": "admin", "role": "pmmMonitor" },
        { "db": "local", "role": "read" },
        { "db": "admin", "role": "clusterMonitor" },
        { "db": "admin", "role": "directShardOperations" }
    ]
})
If you intend to use PMM’s backup management features, grant these additional permissions:
db.getSiblingDB("admin").createUser({
    "user": "pmm",
    "pwd": "<SECURE_PASSWORD>",  // Replace with a secure password
    "roles": [
        { "db" : "admin", "role": "pmmMonitor" },
        { "db" : "local", "role": "read" },
        { "db" : "admin", "role" : "readWrite", "collection": "" },
        { "db" : "admin", "role" : "backup" },
        { "db" : "admin", "role" : "clusterMonitor" },
        { "db" : "admin", "role" : "restore" },
        { "db" : "admin", "role" : "pbmAnyAction" },
        { "db" : "admin", "role": "directShardOperations" }
    ]
})
db.getSiblingDB("admin").createUser({
    "user": "pmm",
    "pwd": "pmm",
    "roles": [
        { "db": "admin", "role": "pmmMonitor" },
        { "db": "local", "role": "read" },
        { "db": "admin", "role": "clusterMonitor" }
    ]
})
If you intend to use PMM’s backup management features, also grant these additional permissions:
db.getSiblingDB("admin").createUser({
    "user": "pmm",
    "pwd": "pmm",
    "roles": [
        { "db" : "admin", "role": "pmmMonitor" },
        { "db" : "local", "role": "read" },
        { "db" : "admin", "role" : "readWrite", "collection": "" },
        { "db" : "admin", "role" : "backup" },
        { "db" : "admin", "role" : "clusterMonitor" },
        { "db" : "admin", "role" : "restore" },
        { "db" : "admin", "role" : "pbmAnyAction" }
    ]
})
Enable MongoDB profiling for Query Analytics (QAN)
To use PMM QAN, you must turn on MongoDB’s profiling feature. By default, profiling is turned off as it can adversely affect the performance of the database server.
Choose one of the following methods to enable profiling:
This method ensures your settings persist across server restarts and system reboots. It’s the recommended approach for production environments:
- Edit the configuration file (usually
/etc/mongod.conf). -
Add or modify the
operationProfilingsection in the configuration file. Pay close attention to indentation as YAML is whitespace-sensitive:These settings control the following:operationProfiling: mode: all slowOpThresholdMs: 200 rateLimit: 100mode: all- Collects data for all operations.slowOpThresholdMs: 200- Marks operations exceeding 200ms as “slow.”rateLimit: 100- Limits profiling sampling rate (Percona Server for MongoDB only).
For more information about profiling configuration options, see the MongoDB documentation and the Percona Server for MongoDB documentation.
-
Restart the
mongodservice using the appropriate command for your system. For example, forsystemd:systemctl restart mongod
Use this method when starting the MongoDB server manually:
mongod --dbpath=DATABASEDIR --profile 2 --slowms 200 --rateLimit 100
--dbpath: The path to database files (usually/var/lib/mongo).--profile: The MongoDB profiling level. A value of2tells the server to collect profiling data for all operations. To lower the load on the server, use a value of1to only record slow operations.--slowms: An operation is classified as slow if it runs for longer than this number of milliseconds.-
--rateLimit: (Only available with Percona Server for MongoDB.) The sample rate of profiled queries. A value of100means sample every 100th fast query. (Read more)Caution
Smaller values improve accuracy but can adversely affect the performance of your server.
This method enables profiling until the next server restart. Profiling must be enabled for each database you want to monitor. For example, to enable the profiler in the testdb, run this:
use testdb
db.setProfilingLevel(2, {slowms: 0})
If you have already added a service, you should remove it and re-add it after changing the profiling level.
Configure query source for MongoDB
PMM offers two methods for collecting MongoDB query analytics. Use the comparison table below to choose the method that best fits your environment:
Compare query source methods
| Feature | Traditional profiler | mongolog |
|---|---|---|
| Database connections | Uses pool continuously | One connection at startup to get log path |
| Connection pool impact | High | Minimal |
Requires system.profile |
Yes | No |
| Support remote instances | Yes | No |
Supports mongos |
No | Yes |
| Database overhead | Moderate-High | Minimal |
| File-based logging | No | Yes |
| Query history durability | Volatile | Disk-persisted |
| Scales with DB count | Linear degradation | Constant |
The standard method uses MongoDB’s built-in profiler to collect query metrics from the system.profile collection.
The profiler queries system.profile collections for each database using active database connections to provide real-time query analytics. This is the default method when adding MongoDB services to PMM.
Best for
- Small to medium deployments (< 100 databases)
- Environments with available connection pool capacity
- Simple setups where profiler access is unrestricted
- Remote instances
Key advantages
- Real-time query collection and analysis
- No additional file system access required
- Works with managed MongoDB services
- Immediate data availability after profiling is enabled
Since PMM 3.3.0, mongolog collects query metrics by parsing MongoDB’s slow query logs directly from disk, solving connection pool exhaustion issues in high-traffic environments.
Why mongolog solves connection pool issues
When using the traditional profiler method, PMM-Agent queries compete with application traffic for database connections. In environments with 100+ databases, this leads to errors like:
“couldn’t create system.profile iterator, reason: timed out while checking out a connection from connection pool: context deadline exceeded”
This occurs because PMM-Agent tries to query system.profile collections across all databases, consuming all available connections and causing monitoring queries to timeout.
Mongolog eliminates this by reading MongoDB’s slow query logs directly from disk, using one connection at startup to get the log path, then zero connections for metrics collection.
Best for
- High-scale environments with 100+ databases
- Production workloads requiring minimal overhead
- Environments experiencing connection pool exhaustion
mongosrouters or managed services with restrictedsystem.profileaccess
Key advantages
- Zero database connections required for metrics collection
- Eliminates connection pool errors completely
- Scales linearly regardless of database count
- Identical query analytics data as traditional profiler
Set up mongolog for MongoDB
Before setting up mongolog, ensure you have:
- MongoDB 5.0+ (tested with 5.0.20-17)
- MongoDB server must have write access to the configured log directory
- Log file readable by PMM Agent user
To configure mongolog for MongoDB:
-
Choose one of the following methods to configure MongoDB to log slow operations to a file:
Edit your MongoDB configuration file (
mongod.conf):systemLog: destination: file path: /var/log/mongodb/mongod.log logAppend: true operationProfiling: mode: slowOp slowOpThresholdMs: 100Configuration explained
destination: file- ensures MongoDB logs to a file (required for mongolog)path- specifies the log file location that mongolog will readlogAppend: true- appends to existing log file instead of overwritingmode: slowOp- logs operations to file only (does NOT populate system.profile)slowOpThresholdMs: 100- set based on your performance requirements
Restart MongoDB after making changes:
systemctl restart mongodStart
mongodwith these flags:mongod \ --dbpath /var/lib/mongo \ --logpath /var/log/mongodb/mongod.log \ --logappend \ --profile 1 \ --slowms 100Flag reference
Flag Purpose --logpathEnables logging to a file (required by mongolog) --logappendAppends to the log file instead of overwriting --profile 1Enables logging of slow operations (not full profiling) --slowms 100Sets slow operation threshold (in milliseconds) -
Create a logrotate configuration file (e.g.,
/etc/logrotate.d/mongodb) to configure log rotation:/var/log/mongodb/mongod.log { daily rotate 7 compress delaycompress copytruncate missingok notifempty create 640 mongodb mongodb }Critical requirements
- Use
copytruncateto preserve file handle for mongolog - Avoid moving/renaming log files as this breaks mongolog’s file tail
- Do not delete active log files during rotation
- Use
-
Add MongoDB service with mongolog, using the
--query-source=mongologparameter:pmm-admin add mongodb \ --query-source=mongolog \ --username=pmm \ --password=your_secure_password \ 127.0.0.1 -
Check that mongolog is working correctly:
pmm-admin statusLook for
mongod_mongolog_agentand confirm that the agent is running with mongolog as the query source.
Setup requirements
MongoDB must be configured to log slow operations to a file and pmm-agent should have access to those MongoDB log files. Ensure the log file is readable by the user running the PMM Agent.
Add MongoDB service to PMM
After configuring your database server, add a MongoDB service using either the user interface or the command line.
Important
To monitor MongoDB sharded clusters, PMM requires access to all cluster components. Make sure to add all config servers, shards, and at least one mongos router. Otherwise, PMM will not be able to correctly collect metrics and populate dashboards.
Use pmm-admin to add the database server as a service using one of these example commands:
pmm-admin add mongodb \
--username=pmm \
--password=your_secure_password
pmm-admin add mongodb \
--query-source=mongolog \
--username=pmm \
--password=your_secure_password
pmm-admin add mongodb \
--username=pmm \
--password=your_secure_password \
--cluster=my_cluster_name \
--replication-set=rs1  # Optional: specify replication set name
pmm-admin add mongodb \
--username=pmm \
--password=your_secure_password \
--tls \
--tls-certificate-key-file=/path/to/client.pem \
--tls-certificate-key-file-password=cert_password \  # If certificate has password
--tls-ca-file=/path/to/ca.pem \
--authentication-mechanism=MONGODB-X509 \  # For X.509 authentication
--authentication-database=$external      # For X.509 authentication
When successful, PMM Client will print MongoDB Service added with the service’s ID and name. Use the --environment and --custom-labels options to set tags for the service to help identify them.
Tips
- When adding nodes to a sharded cluster, ensure to add each node separately using the
--cluster myclusteroption. This allows the MongoDB Cluster Summary dashboard to populate correctly. - You can also use the
--replication-setoption to specify a replication set. For instance, you can use--replication-set configfor your config servers;--replication-set rs1for your servers in the first replica set,--replication-set rs2for your servers in the second replica set, and so on. - When running mongos routers in containers, specify the
diagnosticDataCollectionDirectoryPathto ensure that pmm-agent can properly capture mongos metrics. For example:mongos --setParameter diagnosticDataCollectionDirectoryPath=/var/log/mongo/mongos.diagnostic.data/
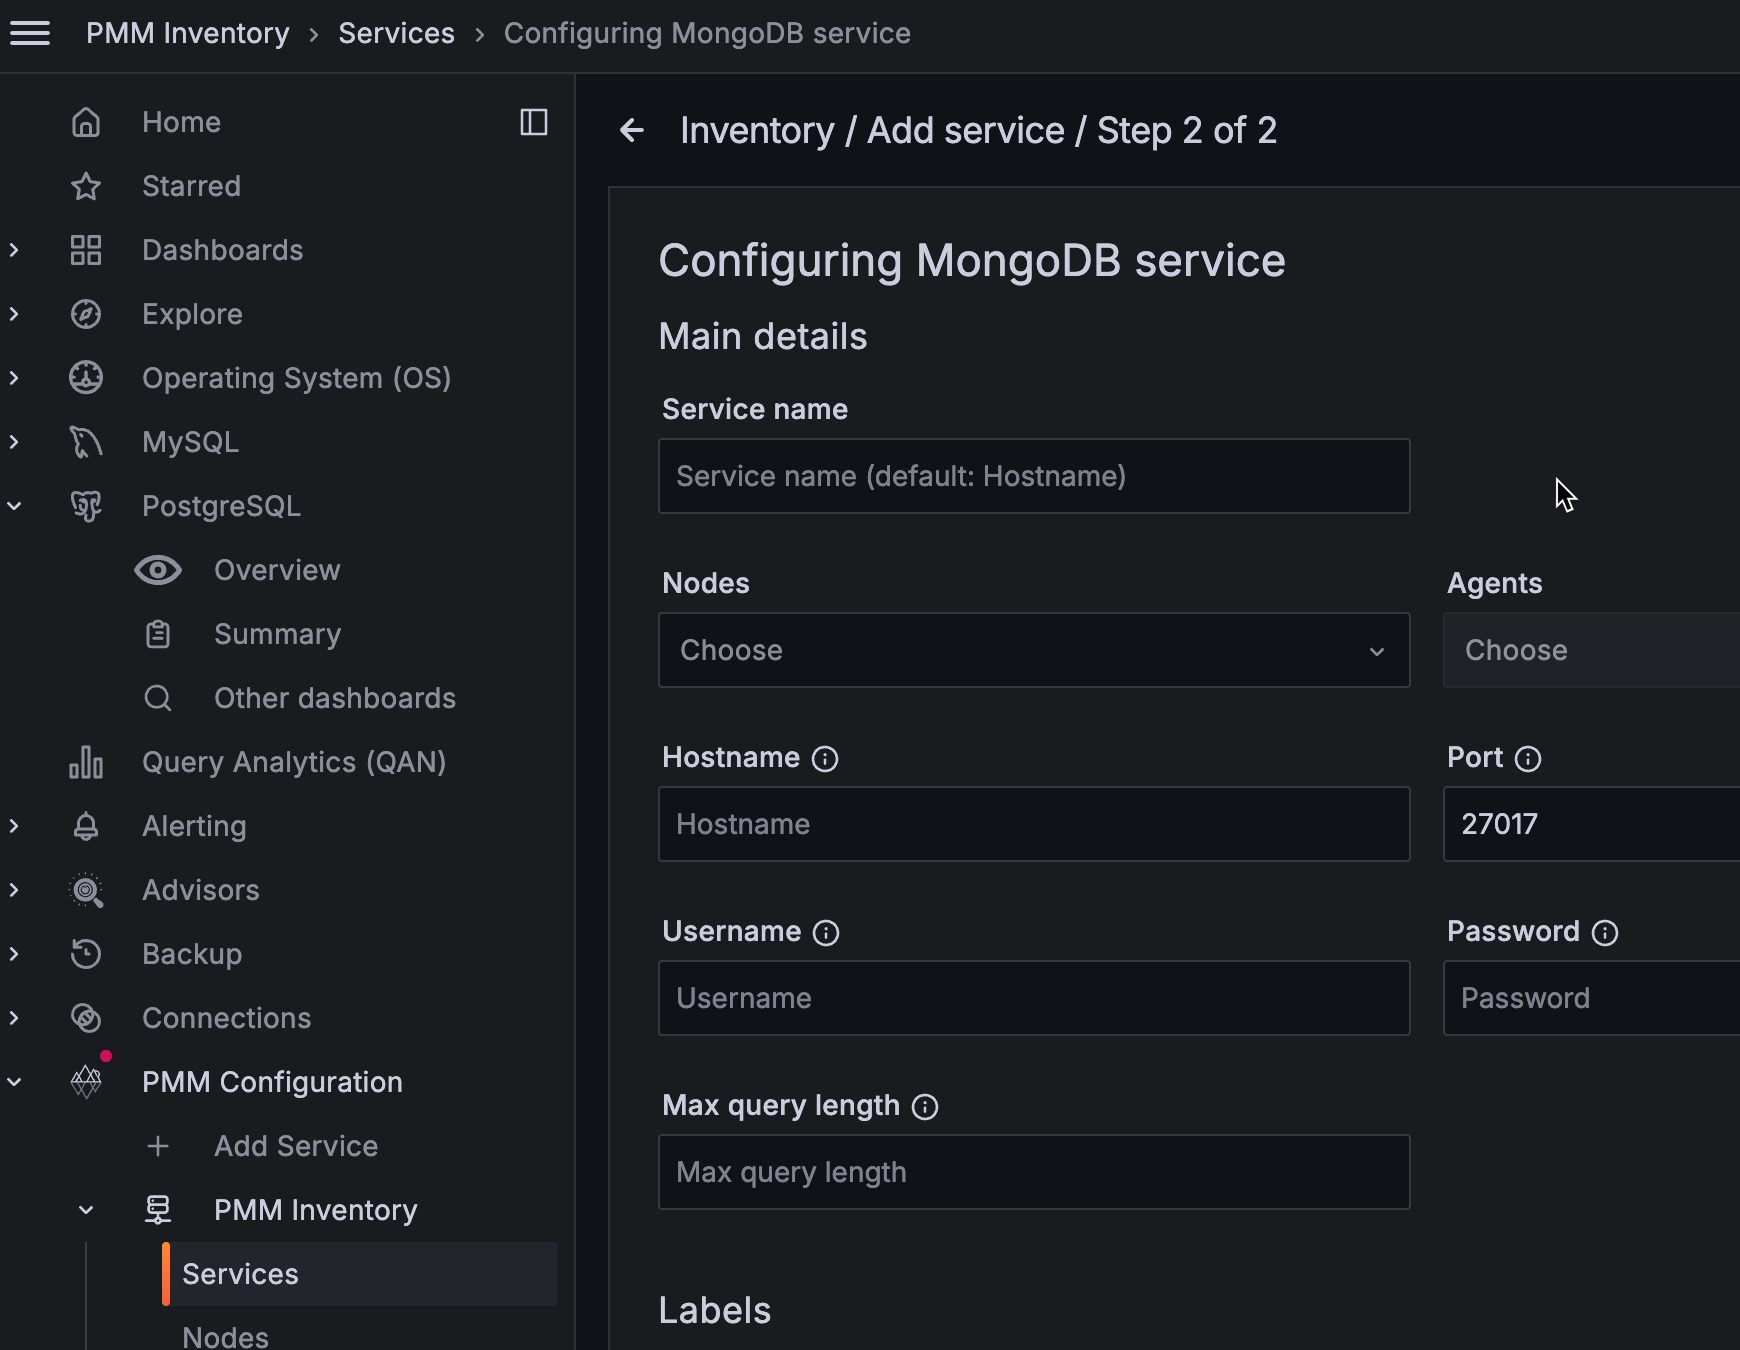
To add a service with the UI:
-
Select PMM Configuration > Add Service > MongoDB.
-
Fill in the required fields.
-
Click Add service.
Verify MongoDB service configuration
After adding MongoDB service to PMM, verify that it’s properly configured and collecting data. This ensures your monitoring setup is working correctly.
-
Check service registration:
Look for your service in the output of this command:
pmm-admin listFor mongolog specifically, verify with:
Look forpmm-admin statusmongodb_mongolog_agent- it should show the agent is running with mongolog as the query source.To check the service from the UI:
- Select PMM Configuration > Inventory > Services.
- Find your MongoDB service in the list and verify it shows Active status.
- Verify the Service name, Addresses, and other connection details are correct.
- In the Options column, expand the Details section to check that agents are properly connected.
-
Verify data collection:
- On the MongoDB Instances Overview dashboard
- Set the Service Name to the newly-added service
- Confirm that metrics are being displayed in the dashboard
-
Verify Query Analytics for the service:
- Open the PMM Query Analytics dashboard and use the filters to select your MongoDB service.
- Check that query data is visible (it may take a few minutes for data to appear after initial setup).
- Performance impact is virtually zero since metrics are sourced from existing log files (for mongolog) or real-time profiler data.
Remove MongoDB service
If you need to remove MongoDB service from PMM, follow these steps:
Replace SERVICE_NAME with the name you used when adding the service. You can list all services with pmm-admin:
pmm-admin remove mongodb SERVICE_NAME
To remove the services through the PMM interface:
- Go to PMM Configuration > Inventory > Services.
- In the Status column, check the box for the service you want to remove and click Delete.
- On the confirmation pop-up, click Delete service and select Force mode if you want to also delete associated Clients.